
Below is the sample Dashboard
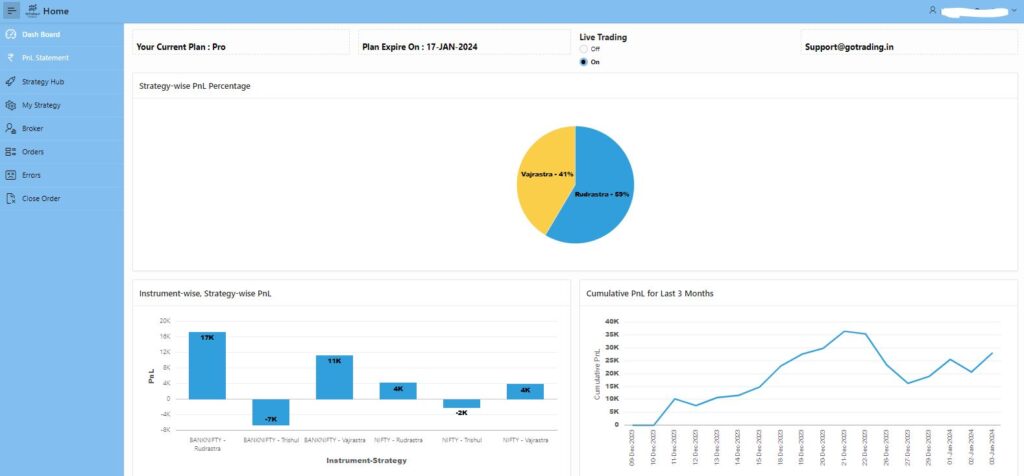
You can measure the performance of your deployed strategy in your account using the personalized dashboard.
- Strategy-wise PnL Percentage : This pie chart shows you how much percentage is the contribution of each of your deployed strategy out of your total profit.

2. Instrument-wise, Strategy-wise PnL : This bar chart shows you how much is the profit made by your deployed strategy in each of the instruments.

3. Cumulative PnL for the last 3 months : This line chart shows your cumulative (profit/loss for the current day keeps on adding to the last total) profit made in the last 3 months.
